The SCAN Dashboards
SCAN Dashboard
The greater Seattle Coronavirus Assessment Network (SCAN) study was a response to the novel coronavirus outbreak (COVID-19). Since March 23rd, 2020, SCAN worked in collaboration with Public Health - Seattle & King County to deliver and collect at-home COVID-19 tests. The SCAN study focused on testing people who experienced symptoms of COVID-19 and worked to increase testing in underrepresented communities and populations.
The SCAN dashboard provides geographic and demographic information from King County about who ordered a test kit (individuals, contacts, and groups) and may differ from the testing data which included all final results (positive, negative, and inconclusive). Reported positives and positivity rate are a combination of general SCAN enrollment and contact testing results, and are not representative of overall population frequency. There was a pause in testing from May 13th through June 9th, during which time SCAN worked with the FDA to update procedures and certifications. More information on that pause is available here. Data was collected through July 31, 2022.
Instructions: Use the tabs on the top to see Kit Distribution and Results and Participant Demographics. Data also can be viewed across different time periods.
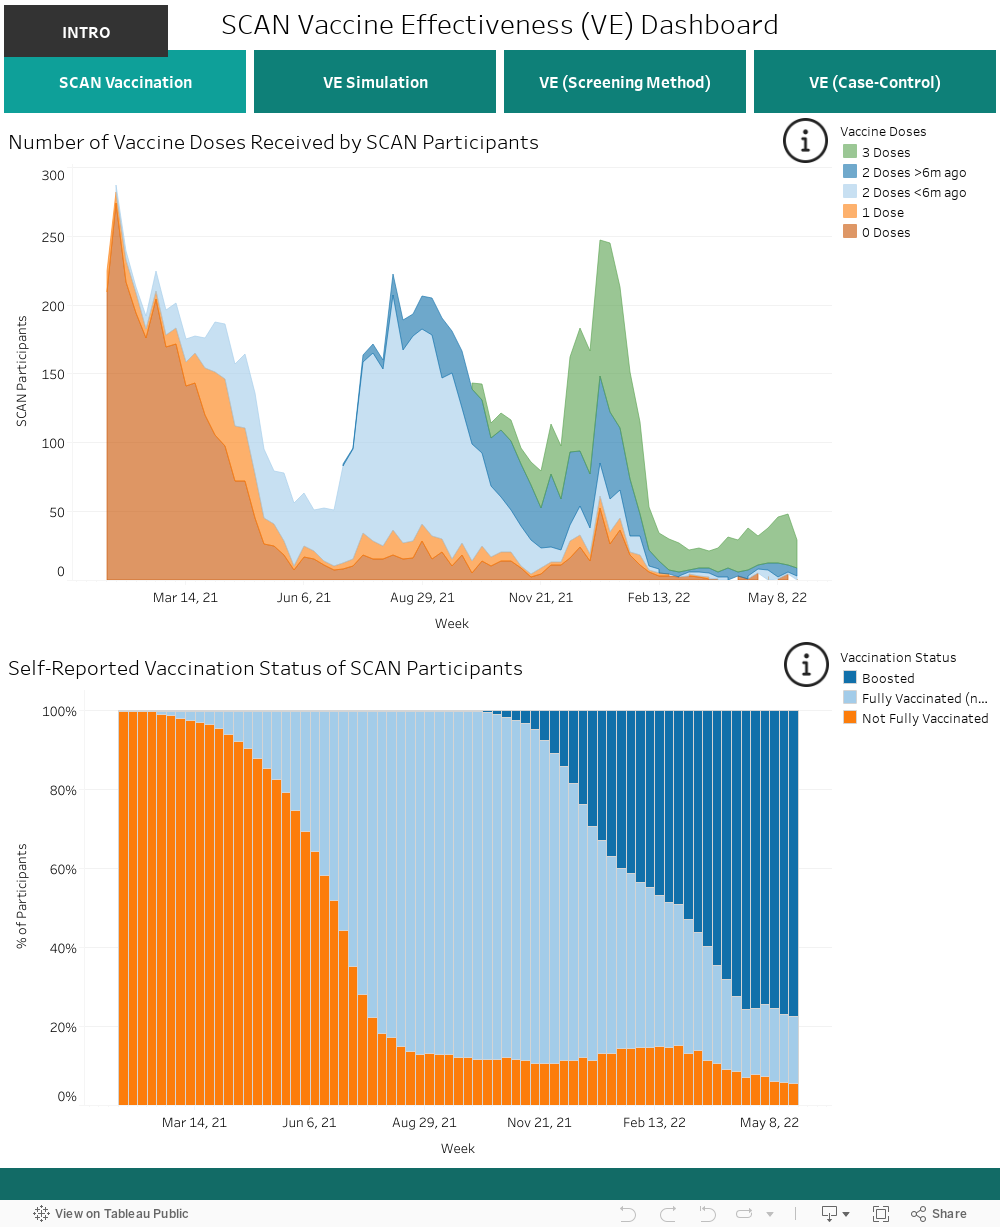
SCAN Vaccine Effectiveness Dashboard
This dashboard reports trends in COVID-19 vaccination and vaccine effectiveness among King County residents enrolled in the Greater Seattle Coronavirus Assessment Network (SCAN), based on self-reported vaccination status. SCAN was launched in March of 2020 to study the COVID-19 pandemic and provided an important service to residents of King County and surrounding areas. Eligibility criteria, which were based on place of residence and symptoms, changed slightly over the course of the study in response to testing demand, with >90% of SCAN participants reporting respiratory symptoms. Eligible individuals enrolled online and received a free testing kit couriered to and from their home for self-collection of a nasal swab. Swabs were tested for presence of SARS-CoV-2 by RT- PCR at the Brotman Baty Institute for Precision Medicine. More information about the SCAN participant population is available on the SCAN Dashboard above.
All vaccine effectiveness estimates presented here are for protection against symptomatic infection. Other studies have demonstrated that vaccine effectiveness against severe health outcomes, such as hospitalization or death, are much higher than the estimates presented on this dashboard.
Vaccine effectiveness estimates represent the expected reduction in risk of disease in vaccinated individuals, compared to unvaccinated. Estimates were developed using two complementary methodologies: the screening method, and a case-control design (logistic regression). Estimates based on the screening method use vaccination status (not fully vaccinated, fully vaccinated, and boosted) and are not adjusted for individual demographic, behavioral or medical factors. Variant estimates are based on the particular time periods when different variants predominated (Pre-Delta: April 1,2021-July 1, 2021; Delta: July 1, 2021-December 12,2021; Omicron: December 12, 2021-Present). The case-control design is an alternative method that provides more detailed estimates. The method allows, for instance, to test whether vaccine effectiveness wanes several months after vaccination, and it can also adjust for age and other baseline differences between individuals enrolled in the study. Estimates use the number of doses received and time since vaccination (3 doses, 2 doses <6 months ago, and 2 doses >6 months ago) and are adjusted for age, sex, race, and region (North or South King County). Variant estimates used molecular testing to identify Delta and Omicron positive participants (cases) while controls were limited to SARS-CoV-2 negative participants in the same weeks when variant cases were identified. Estimates from screening and case-control methodologies may differ slightly as they capture different aspects of the data.
For each vaccine effectiveness estimate, we also provide an alternative measure, which is the relative risk. The relative risk represents the fold increase in risk of symptomatic SARS-CoV-2 infection in unvaccinated vs vaccinated individuals. In the case-control estimates tab, the relative risk is obtained by a method called marginal standardization, which allows for the same adjustments on demographic and geographic characteristics as the vaccine effectiveness estimates from the case-control approach. In the screening method tab, relative risk estimates are based on vaccine effectiveness and the proportion of unvaccinated individuals testing positive, so these are not adjusted for demographic and geographic characteristics.
It is hoped these results provide a helpful resource to people monitoring the effect of vaccines in the ongoing COVID-19 pandemic. Of course, the data are subject to limitations. All variables, including vaccination status, are based on information provided by SCAN participants. While it is expected that incorrect reporting of vaccination status is minimal, it should be recognized that such reporting may affect the estimates of vaccine effectiveness. Participants who received non-US approved vaccines were excluded. A higher proportion of SCAN participants have been vaccinated compared to the general King County population; in turn, these results cannot be generalized to the wider community. For information on vaccinations among the general King County population, please visit Public Health Seattle King County’s COVID-19 Outcomes by Vaccination Status Dashboard